Environment & Energy
Related: About this forumDetermining the Source of Water from the Combustion of Dangerous Fossil Fuels by Oxygen Isotopes.
The paper I'll briefly discuss in this post is this one: Measurements of Combustion-Derived Water Vapor Isotopic Composition from Different Fossil Fuels Meng Xing, Junji Cao, Zhoufeng Wang, Qiyuan Wang, Wenwu Cai, Jie Tian, Jianjun Li, and Weiguo Liu, Environmental Science & Technology 2026 60 (3), 2615-2626
Oxygen has three stable isotopes, overwhelmingly dominated by the doubly magic isotope 16O. (Eight is a "magic number" in nuclear physics, isotopes have a magic number of protons or neutrons or both are unusually stable. sup]16O has 8 neutrons and 8 protons. ) The other two stable isotopes are sup]17O and sup]18O, which respectively account for roughly 0.04% and 0.2%, depending on source, as noted in the paper.
I have always wondered how much of the water in the atmosphere comes from the combustion of dangerous fossil fuels, and the paper suggests an answer.
From the paper's introduction:
Generally, the isotopic composition of NWV undergoes fractionation through hydrological and biogeochemical processes, including evaporation, transpiration, atmospheric transport, mixing, biological utilization, and atmospheric chemical reactions. (13) In contrast, CDWV originates from the oxidation of H atoms in fossil fuels with atmospheric molecular oxygen (O2). Consequently, the δ2Hv of the resultant water vapor molecules preserves the original isotopic imprint of fossil fuel-bound hydrogen, while their δ18Ov is jointly governed by the isotopic characteristics of O atoms in both the fuel matrix and atmospheric O2. During biological synthesis, organisms exhibit preferential utilization of lighter hydrogen isotopes (1H over 2H), a process termed biosynthetic discrimination. This metabolic selectivity results in deuterium atom depletion (δ2H values more negative) in fossil fuels relative to the Vienna Standard Mean Ocean Water (VSMOW) reference. (14,15) Consequently, CDWV inherits this 2H-depleted signature. In contrast, the δ18Ov of CDWV predominantly reflects the isotopic inheritance from atmospheric O2, which exhibits a characteristic δ18O value of +23.9‰, (16) and results in its signature being markedly enriched compared to NWV...
The oxygen in the combustion gases partially result from atmospheric oxygen, and the authors discuss this issue extensively.
Several figures in the text show this point, mixing ratios, but I will not have the time to elaborate on this point from the paper.
Here, however is one figure from the text:
The caption:
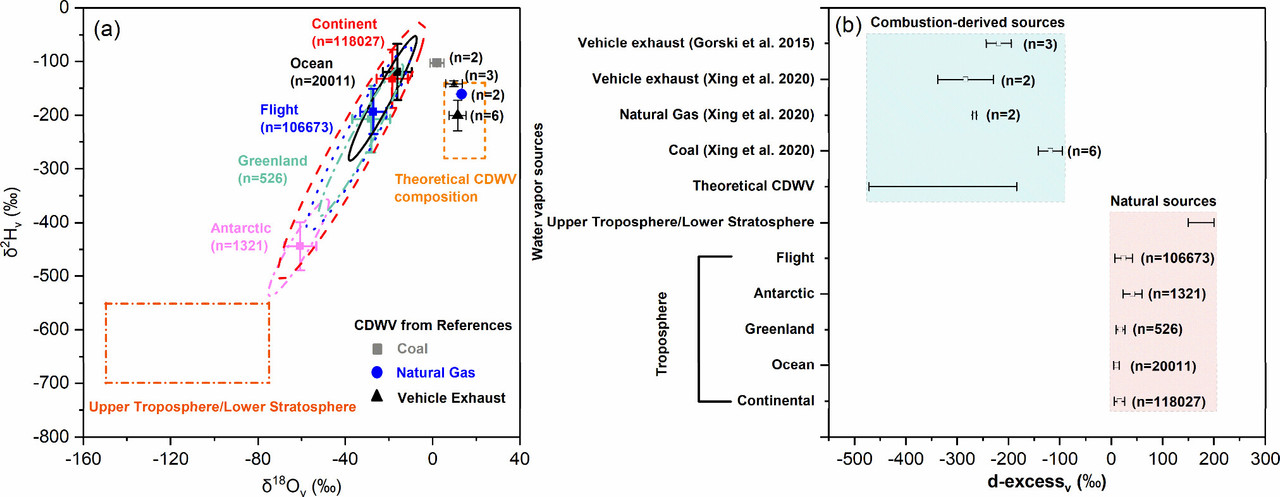
Figure 1. Variation ranges of water vapor δ18O and δ2H in the troposphere (data from Wei et al. (18)), upper troposphere/lower stratosphere (data from Galewsky and Samuels-Crow; (19) Sayres et al.; (20) Yang and Yoshimura (11)), theoretical CDWV (data from Gorski et al.; (6) Fiorella et al. (1)), and reported CDWV in references (data from Gorski et al.; (6) Xing et al. (7)) (a); the same as (a) but for the variation ranges of the d-excessv values (b). Error bars represent one standard deviation of the mean, with the sample sizes (n) provided in parentheses. Theoretical CDWV composition and upper troposphere/lower stratosphere data merely indicate the ranges of variation. In panel (b), blue shading indicates combustion-derived water vapor sources, and red shading indicates natural water vapor sources.
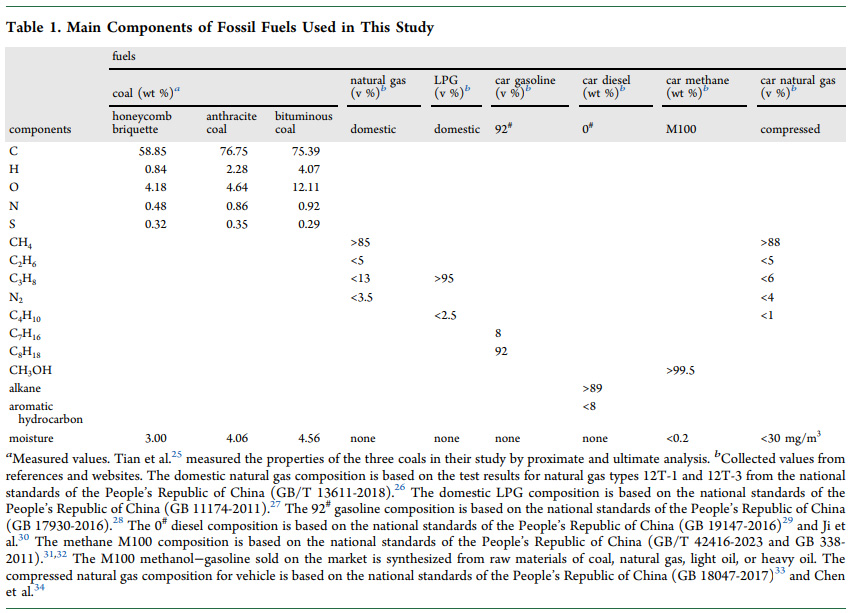
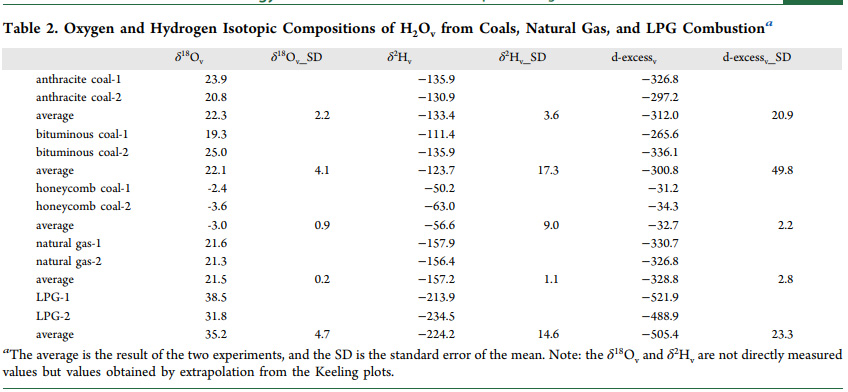
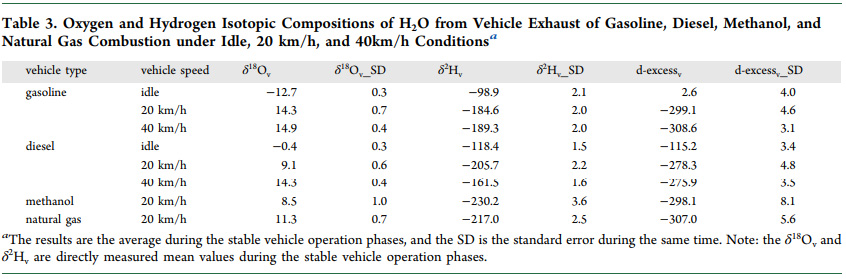
Tables from the text:
An additional figure from the text:
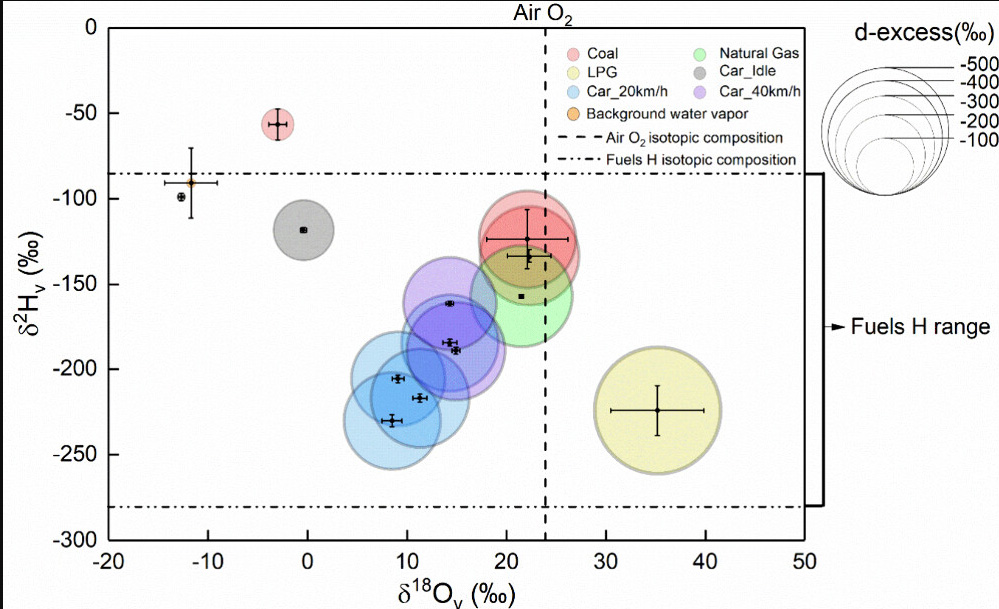
The caption:
The technique used for measurements is one with which I have limited familiarity although I know that it is used at the Mauna Loa Carbon Dioxide Observatory, Cavity Ring Down Spectroscopy, which is based on the decay of emissions generated by exposure of a gas to laser light.
The authors rightly discuss the limitations of the work and avenues of work building upon it.
Have a pleasant Sunday, even if you are, as I am, in the extreme cold regions of the country.