ETA I forgot the dang link:
https://www.bea.gov/news/2025/personal-income-and-outlays-may-2025
Personal Income and Outlays, May 2025
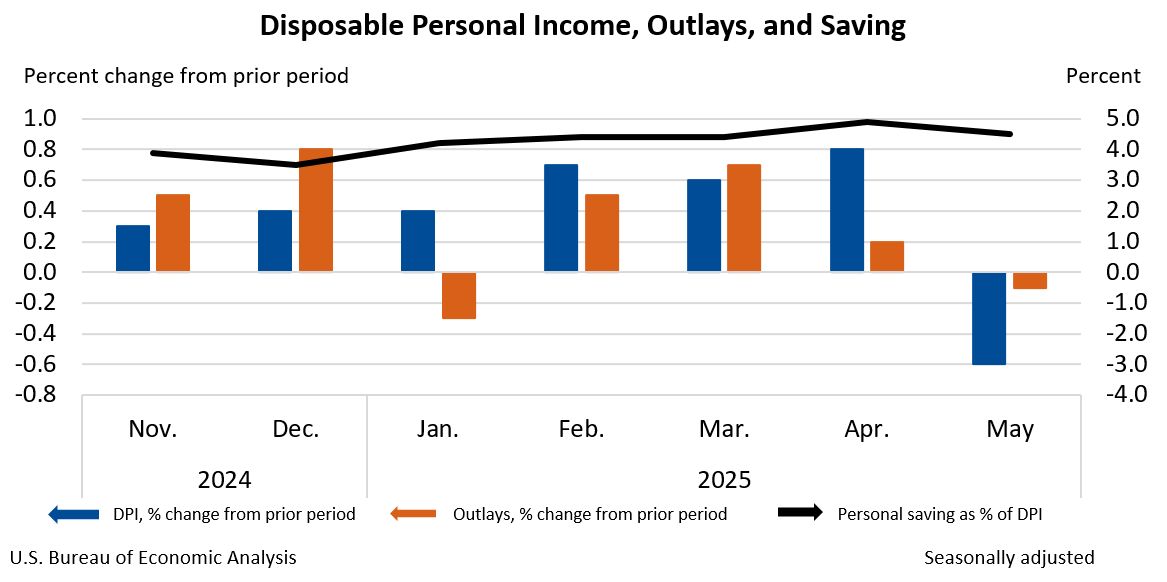
Personal income decreased $109.6 billion (0.4 percent at a monthly rate) in May, according to estimates released today by the U.S. Bureau of Economic Analysis. Disposable personal income (DPI)—personal income less personal current taxes—decreased $125.0 billion (0.6 percent) and personal consumption expenditures (PCE) decreased $29.3 billion (0.1 percent).
Personal outlays—the sum of PCE, personal interest payments, and personal current transfer payments—decreased $27.6 billion in May. Personal saving was $1.01 trillion in May and the personal saving rate—personal saving as a percentage of disposable personal income—was 4.5 percent.
In the above, the bolding is in the original. I added the underlining.
And now the graph.
Crucially, the left scale applies to the bars on the chart -- the DPI and Outlays - While the right scale applies to the black wavy line, the personal savings as % of DPI. (For the longest time I was looking at the May bars and comparing them to the right-side scale and thinking, this does not compute

)
Excerpt from the report again - I added the bolding
The decrease in current-dollar personal income in May primarily reflected decreases in government social benefits to persons and in farm proprietors' income that were partly offset by an increase in compensation.
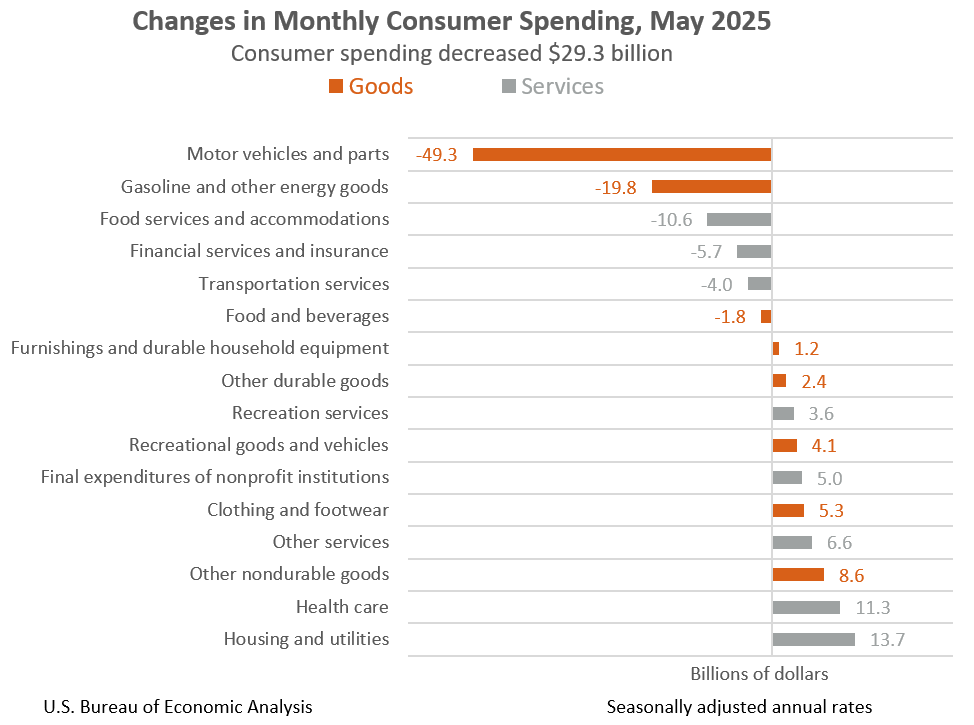
The $29.3 billion decrease in current-dollar PCE in May reflected a decrease of $49.2 billion in spending on goods that was partly offset by an increase of $19.9 billion in spending for services.
Another excerpt:
The decrease in government social benefits to persons was led by Social Security payments, reflecting a decrease in payments associated with the Social Security Fairness Act.
The decrease in farm proprietors' income primarily reflected the pattern of payments from the Emergency Commodity Assistance Program as part of the American Relief Act.

 = new reply since forum marked as read