Welcome to DU!
The truly grassroots left-of-center political community where regular people, not algorithms, drive the discussions and set the standards.
Join the community:
Create a free account
Support DU (and get rid of ads!):
Become a Star Member
Latest Breaking News
Editorials & Other Articles
General Discussion
The DU Lounge
All Forums
Issue Forums
Culture Forums
Alliance Forums
Region Forums
Support Forums
Help & Search
S&P 500 closed Wednesday 12/24 at 6932, up 0.3% to a new ATH # Weekly unemployment claims drop 10k to 214k [View all]
This discussion thread is pinned.
Last edited Wed Dec 24, 2025, 05:46 PM - Edit history (226)
In the future I will only be doing these twice a week: Tuesday and Friday, unless it's really interesting.10 Year TREASURY YIELD 4.14% on 12/24 - 0.03, It was 4.19% on Friday 12/12 (It local-bottomed out at 3.95% 10/22/25, its lowest point since April.)
https://finance.yahoo.com/quote/%5ETNX/
Bitcoin: $87,630 @ 4:57 PM ET 12/24 up 0.05% from yesterday. It was $90,381 last Friday, It has wiped out all its gains for 2025 -- it ended 2024 at $93,429. It's in bear market territory, down more than 20% from it's $126,000+ all-time high in October (actually down 31% from that level) https://finance.yahoo.com/quote/BTC-USD/
Market news of the day: https://finance.yahoo.com/
How to find the latest Yahoo Finance "stock market today" report if it's not at the finance.yahoo page (note that the headline displayed there does not include the "Stock Market Today" words): click on
https://www.google.com/search?q=%22stock+market+today%22+site%3Afinance.yahoo.com&oq=%22stock+market+today%22+site%3Afinance.yahoo.com
If the link doesn't work for you,
Google: "stock market today" site:finance.yahoo.com
https://finance.yahoo.com/news/live/stock-market-today-dow-sp-500-notch-records-nasdaq-gains-as-wall-street-flies-high-into-christmas-holiday-180542226.html
Stock market today: Dow, S&P 500 notch records, Nasdaq gains as Wall Street flies high into Christmas holiday, Yahoo Finance 12/24/25
. . . US stocks set more records on Wednesday, as Wall Street rode into the Christmas holiday on a high note.
But the GDP data led investors to trim bets on a January rate cut from the Fed — just more than 13% now expect that outcome. ((See the "Recent and Coming up, reports" section about yesterday's surprise 4.3% annualized rate Q3 GDP report -progree))
Investors got one more sign of an economy that is nominally moving in the right direction, as unemployment claims fell for the second week in a row, according to data released Wednesday (https://www.reuters.com/world/us/us-weekly-jobless-claims-unexpectedly-fall-2025-12-24/ ) — even as consumer confidence continues to falter. ((unemployment claims down 10k to 214k -progree))
Elsewhere, precious metals powered ahead on Wednesday, with gold (GC=F) rising to an all-time high above $4,500 an ounce before paring gains. Silver (SI=F) also advanced to a record, while platinum (PL=F) reversed, shedding more than 3%. Oil (BZ=F, CL=F) steadied after a run-up through the last few days.
Intel (INTC) managed to pare losses to a drop of around 0.5% on the day after reports that Nvidia (NVDA) had halted a test using Intel's fabrication process for advanced chips.
((Scrolling down the page -progree))
The average 30-year mortgage rate was 6.18% through Wednesday, from 6.21% a week earlier, according to Freddie Mac data. The average 15-year mortgage rate rose slightly, to 5.5% from 5.47%.
A report from the Bank of America Institute published on Dec. 22 showed spending from consumers in the top third of the income distribution rose 4% over the prior year in November, the fastest level of growth in four years. Spending from households in the lowest third of the income distribution is up less than 1% over the same period.
-----
Scroll down to see earlier in the day reports
And scroll down to the bottom of this post to look at the amazing Oil price graph
How major US stock indexes fared Wednesday, AP, 12/24/2025
https://finance.yahoo.com/news/major-us-stock-indexes-fared-182410187.html
How the 4 major market averages fared for today, for the week (since last Friday), and for the year (since December 31),
See Reply #1 to this thread for last Tuesday's many reports -- the big BLS jobs report, the ADP private payrolls report, and the retail sales report (there are also summaries of these in the "Recent and Coming Up, Reports" section just below.)
========
Recent and Coming Up, Reports (I'm also keeping the Dec 16 - Dec 19 ones for now
https://www.marketwatch.com/economy-politics/calendar
The government reports are all seasonally adjusted, as are most, if not all, of the non-government reports the media covers, so please don't post comments about how the numbers look good (or not as bad as expected) only because of Christmas season hires or Christmas shopping -- seasonal factors like that have been adjusted for
TUE DECEMBER 16:
* The long-delayed big Jobs report (featuring the headline non-farm payroll jobs and unemployment rate) (govt). Expected: +50,000 jobs in November and 4.5% unemployment rate. Actual: -105,000 in October and +64,000 in November for a net drop of jobs over these 2 months of 41,000. Nonfarm payroll jobs averaged only 17k/month over the last 7 months and 22k over the last 3 months. These are seasonally adjusted numbers. The raw numbers (i.e. not seasonally adjusted numbers) are 204k/month and 416k/month respectively.And the unemployment rate is 4.6% in November, up from 4.4% in September. LBN thread: https://www.democraticunderground.com/10143583215
There was not, and never will be a separate October jobs report. The payroll stuff Establishment survey was taken and will be included in the November report (as it was in the Decmber 16 report). The household survey that produces the unemployment rate was not done in October, and so the October unemployment rate will be a blank in the records forever.
* Retail Sales for October (delayed, govt) - result: +0.1% in September and +0.0% in October, in nominal dollars. But in inflation-adjusted dollars, it was -0.2% in September, and will be -0.3% in October if October's month-over-month inflation rates comes in the same as September's 0.3%. https://www.msn.com/en-us/money/markets/retail-sales-flat-in-october-as-uncertainty-tempers-consumer-spending/ar-AA1SsP9b
* S&P flash U.S. services and manufacturing PMI's (non-govt) - I haven't looked at this yet
THUR DECEMBER 18:
* Weekly unemployment insurance claims for the week ending Dec 13 (it was 236,000 for the week ending Dec 6) - In the week ending December 13, the advance figure for seasonally adjusted initial claims was 224,000, a decrease of 13,000 from the previous week's revised level. The previous week's level was revised up by 1,000 from 236,000 to 237,000. (govt)
* Consumer price index for November (govt) (note: the one for October was cancelled. The November one was originally scheduled for December 10 before the Fed's rate-setting meeting, but alas was delayed until 8 days after the meeting) - result: 2.7% year-over-year, a cooling from the 3.0% year-over-year reported in the September report, and a 0.2% increase over the last 2 months. LBN thread: https://www.democraticunderground.com/10143584377
FRIDAY DECEMBER 19
* Existing home sales (non-govt) - I haven't looked at yet
* Consumer Sentiment final (non-govt) - here's an article:
https://finance.yahoo.com/news/consumer-sentiment-shows-substantial-decline-from-last-year-amid-higher-prices-tough-job-market-160618145.html
TUESDAY DECEMBER 23
* GDP Q3 first estimate (delayed report, normally released late September). (govt) -- it came in at a 4.3% annualized rate, well above the 3.3% rate economists were expecting. Various factors cited in media: an acceleration of EV purchases prior to the Sept 30 expiration of tax credits. A lot of spending by big tech companies on AI (investment spending boosts the GDP number). A substantial rise in exports (up 8.8% annualized rate) and a small drop in imports -- both these boost the GDP number, Federal spending also played a sizable role, a reflection of the large uptick in defense spending as well as buyouts for federal workers. Also, it reflects the "K-shaped" economy -- higher-income people flush with growing stock market wealth increased their spending, while lesser-income people struggled with higher prices and a weakening job market.
LBN thread: https://www.democraticunderground.com/10143587157 ## From the source: https://www.bea.gov/news/2025/gross-domestic-product-3rd-quarter-2025-initial-estimate-and-corporate-profits
* Consumer Confidence (Conference Board, non-govt) - result: the 5th straight month of decline. The worst since April, and at about the same level as seen in the 2020 pandemic year. Except there is no microbe-driven pandemic, it's all Trumpdemic now. Consumers’ assessments of their current economic situation tumbled 9.5 points to 116.8.
LBN thread (see graph in reply #2) https://www.democraticunderground.com/10143587258
* Durable goods orders - I haven't looked at yet
* Industrial production and capacity utilization - I haven't looked at yet
WEDNESDAY DECEMBER 24
* Weekly unemployment insurance claims - 224,000 was reported December 18. 214,000 was reported today, December 24, a drop of 10,000 . But continuing claims rose by 38,000 to 1.92 million (govt)
NO REPORTS DECEMBER 25 NOR DECEMBER 26
Revised release dates for Bureau of Labor Statistics reports: https://www.bls.gov/bls/2025-lapse-revised-release-dates.htm
BEA.GOV news release schedule (they produce reports on the GDP, Retail Sales, PCE Inflation (the Fed's favorite inflation gauge), and Personal Consumption and Income: https://www.bea.gov/news/schedule
=============================================
The S&P 500 closed Wednesday December 24 at 6932, up 0.3% for the day,
and up 19.9% from the 5783 election day closing level,
and up 15.6% from the inauguration eve closing level,
and up 17.9% year-to-date (since the December 31 close)
and UP 0.6% from its recent October 28 high. It set a new high December 23 and again December 24.
S&P 500
# Election day close (11/5/24) 5783
# Last close before inauguration day: (1/17/25): 5997
# 2024 year-end close (12/31/24): 5882
# Trump II era low point (going all the way back to election day Nov5): 4983 on April 8
# October 28 all-time-high: 6890.90, surpassed by today, December 24's all-time high of 6932.00
# Several market indexes: https://finance.yahoo.com/
# S&P 500: https://finance.yahoo.com/quote/%5EGSPC/
https://finance.yahoo.com/quote/%5EGSPC/history/
Bitcoin
Bitcoin ended 2024 at $93,429. https://finance.yahoo.com/quote/BTC-USD/
Bitcoin's all-time interday high: 126,198 on Oct. 6
Bitcoin's all-time closing high: 124,753 on Oct 6.
https://finance.yahoo.com/quote/BTC-USD/history/
========================================================
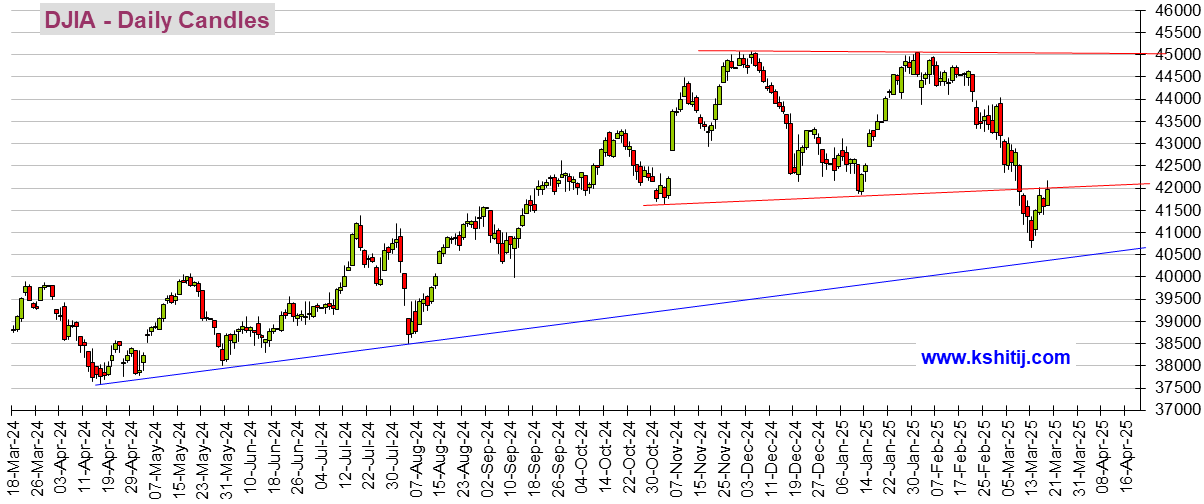
I'm not a fan of the DOW as it is a cherry-picked collection of just 30 stocks that are price-weighted, which is silly. It's as asinine as judging consumer price inflation by picking 30 blue chip consumer items, and weighting them according to their prices. But since there is an automatically updating embedded graphic, here it is. It takes several, like 6 hours, after the close for it to update, like about 10 PM EDT.
(If it still isn't updated, try right-clicking on it and opening in a new tab. #OR# click on https://finance.yahoo.com/quote/%5EDJI/ ).
The Dow closed Tuesday at 48,442, and it closed Wednesday at 48,731, a rise of 0.6% (289 points) for the day
https://finance.yahoo.com/
DOW: https://finance.yahoo.com/quote/%5EDJI/
. . . . . . https://finance.yahoo.com/quote/%5EDJI/history/
DOW
# Election day close (11/5/24) 42,222
# Last close before inauguration day: (1/17/25): 43,488
# 2024 year-end close (12/31/24): 42,544
DJIA means Dow Jones Industrials Average. It takes about 6 hours after the close to update, so check it after 10 PM EDT. Sometimes it takes a couple days (sigh)

I don't have an embeddable graph for the S&P 500, unfortunately, but to see its graph, click on https://finance.yahoo.com/quote/%5EGSPC/
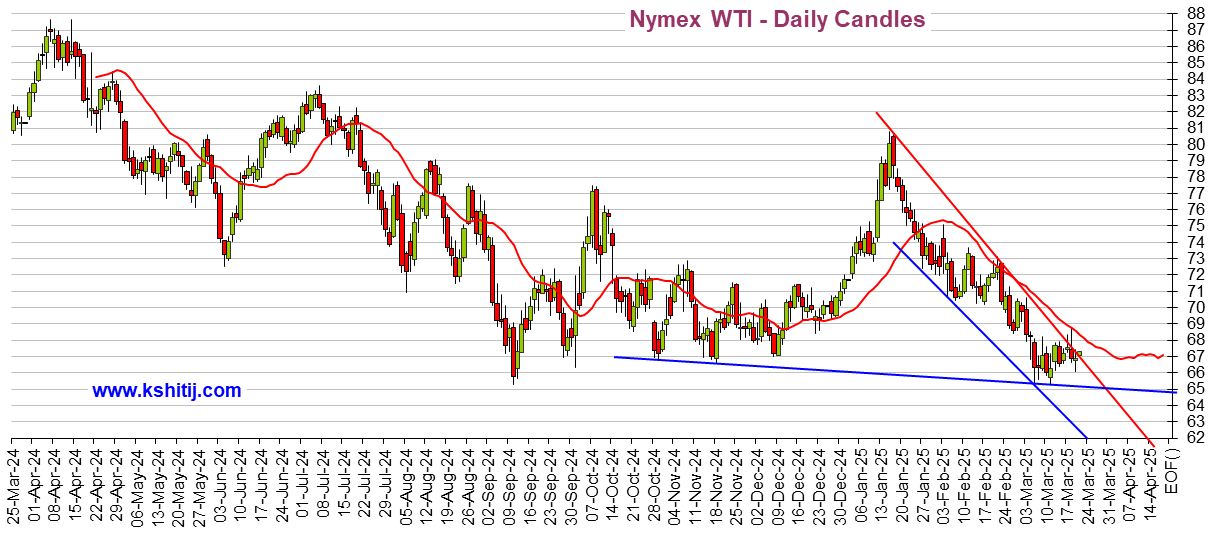
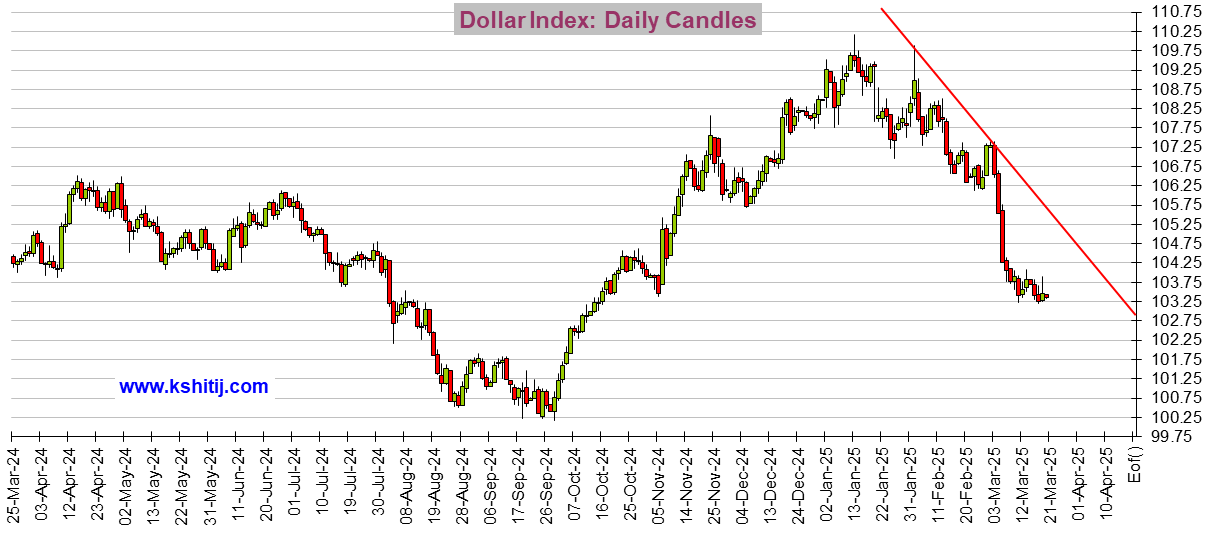
While I'm at it, I might as well show Oil and the Dollar:
Crude Oil

US Dollar Index (DX-Y.NYB)

If you see a tiny graphics square above and no graph, right click on the square and choose "load image". There should be a total of 3 graphs. And remember that it typically takes about 6 hours after the close before these graphs update.
🚨 ❤️ 😬! 😱 < - - emoticon library for future uses
19 replies
 = new reply since forum marked as read
Highlight:
NoneDon't highlight anything
5 newestHighlight 5 most recent replies
S&P 500 closed Wednesday 12/24 at 6932, up 0.3% to a new ATH # Weekly unemployment claims drop 10k to 214k [View all]
progree
Mar 2025
OP
December 16 big jobs report, ADP private payrolls report, and retail sales report
progree
Mar 2025
#1
Kicking: update for Thurs. March 6 close. The "Trump Trade" is back underwater after losing 1.8% for the day (S&P 500)
progree
Mar 2025
#2
Kicking: Update: S&P 500 closed Friday at 5770, up 0.5% for the day but still below the election day close
progree
Mar 2025
#3
Update: S&P 500 closed Monday 3/10 at 5615, down 2.7% for the day and 2.9% below the election day close
progree
Mar 2025
#4
Update: S&P 500 closed Tuesday 3/11 at 5572, down 0.8% for the day, briefly fell into correction territory
progree
Mar 2025
#5
S&P 500 closed Wednesday 3/12 at 5599, up 0.5% for the day, but down 3.2% since election day
progree
Mar 2025
#6
Update: S&P 500 closed Thursday at 5522, down 1.4% for the day, and MORE THAN 10% down from the all-time high
progree
Mar 2025
#7
Update: S&P 500 closed Friday at 5639, up 2.1% for the day, and down 2.5% since election day
progree
Mar 2025
#8
Update: S&P 500 closed Monday at 5675, up 0.6% for the day, and down 1.9% since election day
progree
Mar 2025
#9
Update: S&P 500 closed Tuesday at 5615, down 1.1% for the day, and down 2.9% since election day
progree
Mar 2025
#10
S&P 500 closed Tuesday 3/25 at 5777, up 0.2% for the day, down 0.1% since election day, down 6.0% from ATH
progree
Mar 2025
#11